
MIB Views
Trap Watch
The Trap Watch tool allows you to monitor and examine details of incoming notifications (traps and inform requests) from SNMP agents. Unlike the other tools currently provided in MIB Views, the Trap Watch tool is not tied to an individual agent, but rather an individual port or ports. Thus, the Trap Watch tool is displayed in a separate window from the other tools.
To open the Trap Watch tool, select the Tools → Trap Watch menu item. You'll be asked to select a port to monitor for incoming notifications, as shown below. SNMP agents normally send traps to port 162, the default.
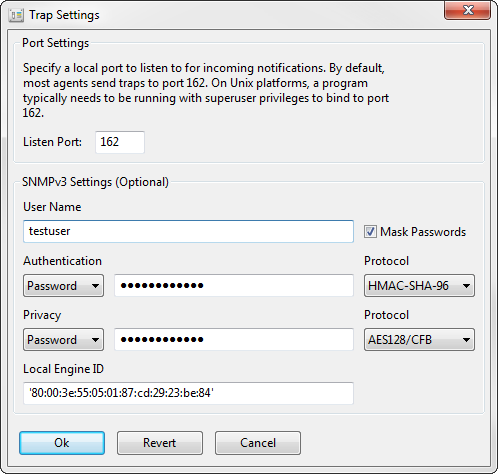
Figure - Trap Port Configuration
SNMPv3 parameters may also be configured for receiving and responding to SNMPv3 Inform Request PDUs using the specified username and optional authentication and privacy passwords. The SNMP Engine ID of your MIB Views installation is shown and is generated the first time you run the application, but be changed if you desire. For SNMPv3 Inform Requests, the recipient (MIB Views) is considered the authoritative SNMP Engine, so the passwords are localized to this Engine ID. The agent sending the inform request needs to be configured to match if using privacy and/or authentication.
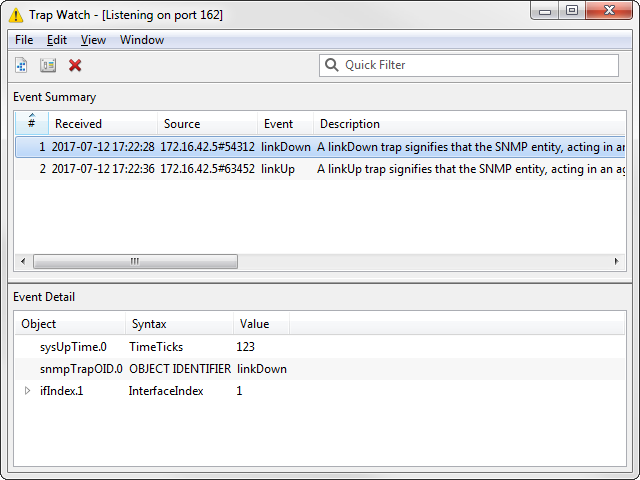
Figure - Trap Watch
After selecting a port and optionally configuring security parameters, the Trap Watch tool will open and will display traps as they're received.
 Click the Settings button to change the trap port and/or security parameters.
 Click the Clear button to clear the event log.
Select an event from the Event Summary list to display details for that event -- that is, all of the values provided in the variable bindings, including values extracted from the instance identifiers for tabular data.